I have built several solutions over the years to enable business users to get at the data they need to do the analysis that is important to them. I would build cubes so that they could slice, dice and mold the data into the shape they need. They would use tools like Excel, Reporting Services and more recently Power BI to interactively work with an entire dataset. Then I entered the world of Big Data when I started building reporting solutions Microsoft’s Bing business teams. All the sudden, the data was too large to fit into one cube. Suddenly it became impractical to have to load all the data into one SQL databases.
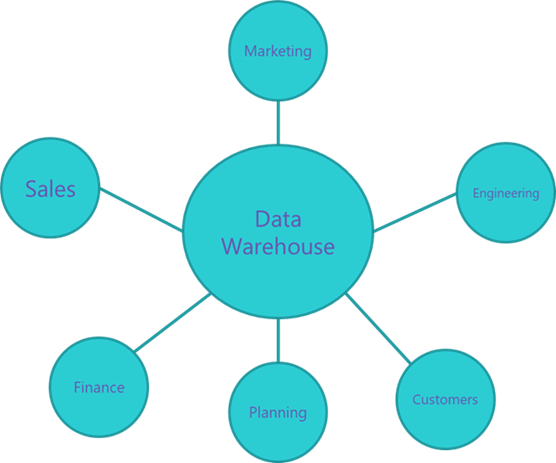
While the size of the data presented many implementation challenges to the development team, it didn’t change what the business users needed to do with it. To enable them to use the same tools they were used to using, we had to make the big data, small. We did this by creating multiple Analysis Services cubes. Each cube was designed to answer questions for specific scenarios. This architecture is known as hub and spoke.
The hub is made up of a large data warehouse with datamarts/cubes serving as the spokes. Since the spokes only need to answer a subset of questions, the size of the data within each spoke is aggregated and much smaller than the hub itself. Hub and spoke allowed us to build a solution which enabled our business users to work with the data using the tools they are used to. However, we had to make the data small. Users had to know which cube to connect to. While each cube had the most important dimensions these users needed, some dimensions had to be sacrificed to make the data smaller. Often, to allow for more dimensionality in a cube, we would need to sacrifice history. Pretty soon we started creating different versions of each cube. One would have more dimensionality with less history and could be used for daily analysis. The other, would have less dimensionality and longer history which would be used for trending and historical analysis. Users would start asking for certain dimensions that were in the daily cube to be in the historical cube because they thought they may need it. We were now building cubes which contained the most commonly used dimensions but also included some less frequently used important dimensions. These less frequently used dimensions would inflate the of the cubes and make all the common queries that didn’t use these dimensions more expensive as they now need to aggregate out these dimensions.
As you can imagine this created a lot of work for the development and operation teams. We had multiple large cubes to maintain and load each day. Making a change to a common dimension could require a change to all the cubes dramatically increasing development costs and the time it takes to deploy a new change.
If a single cube, did not have all the data needed by a user, that user would need to go to the hub/data warehouse to get the data. This required special skills which most of our business users did not have. It also required special tools. If a user wanted to get the data into Excel, they would need to define a query that would export of slice of data. Since the data in the data warehouse was “big,” these queries were expensive and time consuming. Often, it would take a user several days to get the answers they were looking for.
We built a solution that worked, however it was not ideal for the people using, building and maintaining it. We wanted a solution that allowed us to keep the data big without the need to make multiple smaller copies. We wanted the best of both worlds. A solution that allowed users to work with the data like it was small while retaining the fidelity of the data as if it was big without the costs or performance problems that come with big data.
Fast forwarding to present day. Microsoft Power BI recently announced the preview of aggregations. Aggregations allow you to create one BI semantic model over all your data without copying it. Power BI will directly query the data where it lives within the data warehouse. Now, you have one model that your business users can connect to find all the data.
Querying the data where it lives, will let you access all of the data but, running so many queries will put a lot of load on the data warehouse and would require a lot of expensive compute power to make those queries perform well. Since most business users start querying data at a summery level, you can use aggregations to bring an aggregated summary of the data into memory. Now when queries come in, they can be answered directly from memory without needing to hit the data warehouse. This will give end users are great experience using their tools of choice while reducing the load on the data warehouse keeping it available for the detailed queries which actually need to use it. The Vertipaq engine in Power BI can be extremely fast even with a large amount of data, so you may be able to cover 90% of queries with just one or two aggregations.
Power BI aggregations are not just limited to direct query or in memory. Within the same model, you can have multiple direct query sources. If needed, this allows for you to have multiple tiers of data based on how that data is going to be used. For example, you could put your most frequently used data in memory with the goal of covering 70% of the queries. Then you could have another larger aggregation in a SQL database to cover 25% of the queries. Then you could use something like Spark or Azure SQL Data Warehouse to handle the remainder of the queries. The tiering approach allows you to strike the right balance between performance, cost and latency. Since you users are querying the semantic model rather than the data sources directly, you can constantly tune the balance without breaking users.
Aggregations in Power BI change the game for BI development. It allows for a no compromise BI experience over Big Data without needing to make the data small.
Learn how to build your first aggregation
I am a program manager on the Microsoft Power BI team. Opinions in this blog are my own.


Reblogged this on MS Excel | Power Pivot | DAX | SSIS |SQL.
LikeLike
Hi Josh,
Good info.
Do you know if Aggregations and composite models feature released in power bi will also come to Azure Analysis Services?
LikeLike
It is an exclusive Power BI feature.
LikeLike
Ok. I am little confused on how Microsoft takes AAS and Power BI parallely with different features on both of them.
Don’t you think adding Aggregation feature to AAS will help other reporting tools like tableau and qlikview get access to this power full feature?
Also I am under impression that AAS is the enterprise version of power bi data models which has features like Perspectives,Partition Processing…
LikeLike
We are in the process of bringing all AS features to Power BI. Check out this session from Christian https://youtu.be/FIlKTItGpDo
LikeLike
Thank you Josh.
I feel that adding this composite models/Aggregation feature in AAS will benefit the customers who are already building there models in AAS and using live connection from Power BI.
I also see there is an idea posted in AAS forums on this and hope this feature will be available soon.
https://feedback.azure.com/forums/556165-azure-analysis-services/suggestions/17379673-support-for-hybrid-mode
I am repeating this again because customers who are already thinking that for Enterprise BI the best option will be AAS and now when we have a powerful feature like composite model was added to power bi and not in AAS,the question arises to the customers on which way they need to go for Enterprise BI in future.
LikeLike
Thanks Josh. You said, “We are in the process of bringing all AS features to Power BI.” Is it Microsoft’s plan to make Power BI a replacement for AAS? If so, this would seem to mean that in the future, we would connect to Tabular models hosted in Power BI Server? Is this the idea?
LikeLike
You will be able to do everything that you can do with AS just using Power BI. That does include connecting to tabular models hosted on Power BI.
LikeLike
Thank you Josh. Are you at liberty to say why it appears Microsoft is cannibalizing its AAS product by encouraging people to treat the Power BI Service as a Tabular model host (instead of AAS)?
LikeLike
We are not trying to cannibalizes anything. Many customers use both Power BI and Analysis Services. We are attempting to simplify the architecture which will make building and maintains BI solutions in the cloud easier.
LikeLike
Hi Josh – We have a client where Power BI Service Premium might make sense. I wanted to be sure I understood clearly what I think you’re saying in this article. If our client were to purchase Premium, they would be able to host their Tabular models on PBIS and have them accessible to Power BI and Excel from PBIS. Is this correct? Also, am I correct there is a 10 GB limit on any individual Tabular model hosted on PBIS with Premium?
LikeLike
Hi Josh – Are you aware of any roadmap to get RLS implemented in these aggregate models? Or maybe even a workaround to the current limitation?
LikeLike
We are working on adding RLS support now. It is close to complete. Is it blocking you from a deployment?
LikeLike
Awesome! That’s great to know.
No it’s not blocking me from a deployment, not yet at least. Currently building out a few aggregate models for a client and will need to be able to implement RLS in some fashion soon.
LikeLike
Great! You will have it. Let me know how things work out.
LikeLike
Hi Josh,
Can Aggregate Table be created on existing PBI reports due to performance issue or it has to be created before the visuals are in place. I tried creating it on existing report but got this error “Aggregations tables cannot be on the filtering side of relationships to other tables”
LikeLike
It can be added to a model at any time. That error makes it sound like you are trying to add an agg on a dimension table and not a fact.
LikeLike