2013 may not feel like it was that long ago, but for big data, a lot has changed. At the time, Hadoop ruled a very map reduce focused world. Apache Spark was still more than a year away. Google BigQuery and Amazon Redshift were in their infancy. The predecessor to Azure SQL Data Warehouse, PDW, was being sold as an on-premise hardware appliance.
My story actually starts a few years earlier when I first joined Microsoft’s Bing team to focus on delivering BI to internal business users. Upon joining the team, I discovered that a lot of what I had learned about BI, did not easily apply when working with petabytes of data. Over time, our team developed some new ways of thinking about delivering BI at this scale. In 2013, I decided to write down these thoughts in a whitepaper which I intended to publish. I eventually moved on to the Power BI team and I never got around to publishing the whitepaper.
Today, this whitepaper serves as a time capsule of my thoughts from a time when big data was starting out. I found it interesting to reread after spending more than five and a half years on the Analysis Services/Power BI team. I feel like we have incorporated some of the best parts of what I learned during that time into Power BI. Most recently, Power BI released an aggregate awareness feature which enables a similar approach to data tiering as mentioned in the whitepaper.
Some of the language has evolved since the time of writing. The paper speaks a lot about data virtualization, which I believe has taken on a lot more meaning over time. What I called data virtualization back then, mostly describes a a strong semantic modeling layer similar to ones that can be found in products like Analysis Services or Power BI. The paper also references an internal Microsoft big data platform called Cosmos in addition to Hadoop which was more widely used publicly at the time.
Below is the original unedited whitepaper. As you read it, think about the ways you have handle big data over the last few years and how you plan to handle it in the future. Please leave your feedback in the comments below.
Unlocking Big Data for the Masses With Data Virtualization
By Josh Caplan
Greg Koehler, contributor.
Abstract
This paper describes an approach for creating and using virtual data views, with separately framed physical tiers for big data systems and traditional data warehouses. Accessing multiple physical data tiers from a virtual data view exploits the many potential advantages of big data while leveraging an organization’s investment and knowledge of traditional data warehouses. This approach enables a wide variety of users to engage with data at the level, and in the manner, most appropriate to their roles, while reducing cost and increasing agility for the data development and data management teams.
1. Introduction
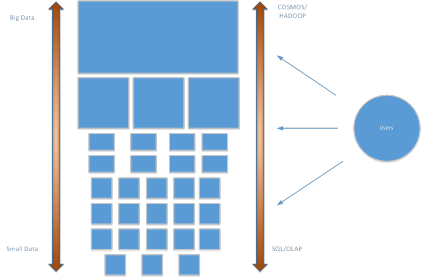
“Big Data” is today widely touted as a game-changing technology, offering enterprises everything from super-customized behavioral profiles of customers, to competitive advantages from complex predictive algorithms, to deep insights gleaned by data scientists through analytic investigations, including answers to questions that may arise long after a product or service has been designed and instrumented to capture data. The subject of what constitutes big data, while a fascinating area, is beyond the scope of this discussion. In this paper, we will simply consider “Big Data” as anything that is too large to fit in a traditional SQL data warehouse, or set of databases, without significant customization to account for the scale of the data. Or, in other pragmatic terms, data that is typically better suited for the massively parallel, distributed server systems, such as Cosmos and Hadoop, and accessed through MapReduce applications.
It is easy to get caught up in the exciting possibilities of big data. A number of businesses from top companies such as Microsoft Bing, Amazon, Google, and Netflix, have well-established strategic goals around exploiting data and analytics to gain advantages over competitors. Many groups are now striving to infuse their work culture with data-driven decisions, fostering an environment where pertinent customer-based information is leveraged across a broad spectrum of roles, including Marketing, Finance, Engineering, Operations and Support.
While the vision of big data is clear, the path to mass, company-wide enlightenment is murkier. Often, if not all the time, a paradox occurs along the path of implementation: It seems once a group has successfully laid the foundation for big data storage and processing, e.g., via Hadoop, they struggle with the next step, namely getting usable data out of the system. In building out big-data pipelines and performing what would be simple tasks with traditional, structured data (we’ll call this “Small Data”), the whole end-to-end process of obtaining even simple data points slows down: Data program managers and developers discover they need to build custom extractors and library files; design custom software managers for data jobs and workflows, sort out how to manage access and security policies across distributed systems with shared resources, and rethink strategies for transferring larger files across domains and networks.
In the end, fulfillment of the Big Data scenarios require so many layers of custom scripts and tools, only a relatively few technically gifted users, often developers, are able to navigate the many obstacles of the physical data landscape and obtain value from the data. In some groups, these ivory-towered specialists become known as big-data analysts or data scientists. These individuals work with big data to obtain relevant insights for specific questions and problems on behalf of the real users — the non-technical users with a vested interest in the data scenario.
In addition to analysts and data scientists, it is common for big-data developers to also be tasked with exposing a specific, curated big-data set to the masses. Essentially, to scale up the distribution of the data by exposing some useful data points to a larger group of would-be data users, the data is condensed — into small data. Big data is boiled down to a subset of common categories and metrics, so it can be brought into traditional data warehouses, databases, OLAP cubes, etc. Once in traditional, small-data format, the information can be shared with groups of general, non-technical users or integrated into the wealth of data tools and user interfaces that plug into these off-the-shelf products, such as SQL, OLAP, and Excel.
It makes a certain amount of sense to develop small data from big data: an organization is able to leverage 25+ years of industry expertise and solutions built around SQL, Excel, and other proven related products. Yet, the great paradox is that by downsizing to Small Data, a group ends up with a data set that is depressingly under-utilized compared to the deep, game-changing scenarios originally promised by big data. The “new” traditional data can now be accessed by the masses, but with greater latency, complexity, and cost compared to just designing and building a small-data system from the outset.
What if there were a way to provide the all the benefits of small data – accessibility, ease-of-use, full ecosystem support — with the full resolution of big data? This is where data virtualization, combined with “data tiering,” comes to the rescue.
2. Current Practice: Making “Big Data” into “Small Data”
A common approach to the accessibility problems of big data is to shrink the information into small data. Small data comes with ready-made tools and highly refined applets, templates, and data services within a coherent data ecosystem, often aligned to industry practices. In short, small data is easier for developers to work with and easier for users to consume.
An organization may proceed with a data shrinkage project by charging a development team with authoring of ETLs (automated procedures to Extract, Transform, and Load data), to condense or summarize a selection of information from a big-data store into smaller SQL marts, OLAP cubes and, eventually, reports. This development team may interact with nontechnical teams, such as business managers, to capture requirements for key metrics and categories of data to summarize; to
identify additional data for analysis of current business questions; and for insight to additional data that may help in future analysis of hypothetical business questions. By necessity, the smaller marts are typically designed to focus on current requirements and analytics needs. Thus, when new questions arise, small-data systems are required to iterate, often through a full development cycle, to connect
a data pipeline from instrumentation and data collection all the way through to delivery of a finished data mart. The length of this development cycle may vary based upon several factors. Some of these factors, called out below, represent inherent disadvantages of the approach to shrink big data:
- Number and complexity of existing marts. As marts are developed and released, the marts require ongoing maintenance. End usage of the marts often results in requests for additional features and improvements to the marts themselves. With each additional mart and mart feature, opportunity costs rises as the development team loses potential resources to allocate to other projects, including the big-data system.
- Quality of data requirements. An often overlooked variable is the accuracy of the stated data requirement. The development team relies on specific data definitions and rules defined by users of the small-data systems. Meanwhile, these users are often non-technical and are placed in the difficult situation of defining requirements without having the technical details of the actual data in the big-data systems. A disconnect in data requirements can cause endless delays the development cycle.
- Hardware resources for storage. It’s important to call out: small data is not necessarily synonymous with cheap data. In fact, the SAN (Storage Area Network) style of storage often used to house small data is often more expensive than the storage used for big data of the equivalent size. While it’s true that much of the big-data is not being stored in the new small-data system, the small-data storage is typically bloated by redundant data sets. This is because one big dataset is generally converted into a number of small data sets. Even a single small dataset, e.g. an OLAP cube, will have an accompanying SQL relational database, as well as aggregations and indexes.
- Deployment time. Even a best-case development scenario, e.g., a simple “5-minute code change” to alter a hierarchy definition, requires deployment. Oftentimes, the deployments require database build events, such as index re-creation and cube reprocessing. Additional cubes and databases with dependencies on the changes also require deployment. It’s not unusual for a global change in business logic or master data definition to impact all small-data systems.
In addition to some of the technical challenges of shrinking big data, there are usability hurdles that accompany the creation of specialized data sets. Including:
- Finding the right dataset. Within a maze of small-data solutions, how does a user know where to find the appropriate data? Without considerable investment in user education and training, end users may experience great difficulty in locating the right physical database/cube/report for his/her particular question. Even with advanced Visio diagrams, data matrices, and decision trees to guide the way, interacting with and navigating through multiple data sets is anything but a fulfilling activity, especially for non-technical users.
- Querying data across multiple datasets. As carefully as the small-datasets are planned and executed, inevitably there are cases where a user is unable to answer a question by remaining within a single dataset. The user is left struggling to discover a way to join multiple datasets together. The joins may be extremely difficult; or impossible, such as with data aggregated and segmented based on IDs that are present only in the big data system.
- Discoverability of new data. As described earlier, small data is typically designed to answer groups of current questions. As a business evolves and new questions arise as well as new paradigms of interpreting the data, it becomes increasingly difficult for users to become aware of the best datasets for their situation.
There are also some positives with the approach to shrink big data to manageable small datasets. Such as:
- User-friendly tools. The importance of end-user tools should not be underestimated. Countless initiatives to onboard new IT systems have failed over the decades after influential users and decision makers have refused to give up their Excel spreadsheets. Here is a short list of the top small-data tools:
- Excel. This undisputed king of analytic tools worldwide, Excel is without equal in enabling the user to format and design custom data reports and scenarios. Excel is also friendly to developers and offers a VBA language and support for custom COM add-ins.
- SSRS. SQL Server Reporting Services is widely used for producing semi-flexible, pre-canned reports. The reports are typically accessed via a simple web browser interface but are also available via custom client applications.
- PowerPivot. The PowerPivot client add-in for Excel allows advanced end users to quickly manipulate millions of rows of data in tabular format. The data can also be viewed with interactive slicers in advanced visualizations using the accompanying PowerView technology in Excel 2013 and PowerPivot-for-SharePoint. Small data can also be republished, transformed, and automatically refreshed on a self-serve basis using PowerPivot-for-SharePoint
- Performance: Since the datasets are smaller, they are typically much faster than big datasets. In many cases, users can execute queries and immediately view reports, without returning at a later date or time to retrieve a report. For standard reports and scorecards that are used on a regular cadence, as well as interactive dashboards, small data is currently the best, most viable option.
- Stable, Expected Results: Small data sets are usually designed to provide specific answers on a regular basis. The finite set of data combinations is often monitored and validated with automated scripts. All of this attention pays off in usability, as end users are able to quickly retrieve the expected results without having to spend time interpreting the meaning of the data.
3. Current Practice: Keeping “Big Data” Big
Another common practice, often implemented in parallel with the data shrinkage approach, is to keep the data in its big, original format, allowing users to access it where it lives, whether in COSMOS or Hadoop, etc. As described in the Introduction, this generally means that only highly technical users are able to access and query the data directly, leaving less technical users with the small-data solutions. At this point, the only practical way to scale up the accessibility of the data is for non-technical users to either obtain time and resources from the relatively few developers or to hire additional developers or onboard specialized technical vendors to work with the users and execute queries on their behalf. The cost of adding more big-data developers to answer more questions is prohibitive, to say the least. Yet the cost of additional data developers is far from the only challenges with this solution. Here are a few other complications with the “leave it big” approach:
- Consistency in Query Practices. While the language and syntax of MapReduce procedures have improved over the years and become more consistent with Oracle and T-SQL, the fact remains that big-data queries are substantially different when built and executed. By design, a great amount of freedom is permitted the data developer in writing and structuring queries. As a consequence, it is common for multiple queries, even by the same developer, to produce subtly different results from variations in logic, syntax or filters. It’s even more common for queries by different developers to produce different results, again, if the intention is for the same result. Finally, the big-data queries frequently won’t match the results coming from the shrunken, business-friendly datasets (method described in section 2).
- Turnaround Time and Throughput. Consider all of the steps required for a developer to produce a finished query from a big-data system:
- It takes time for the developer to consult a user (big-data requestor) what dataset will be possible to obtain
- It takes more time for the initial query to run
- It takes more time to format, evaluate and analyze the results
- It takes more time to refine the query based on the results
- It takes more time for the query to run again
- Etc… (keep repeating these steps until question is answered to the satisfaction of the user)
Next, consider the inverse relationship between quality and throughput. More accurate, detailed analysis, as well as data consistency (previous bullet point) requires a greater level of effort and more time from the developer, resulting in a low level of throughput.
- Hardware Costs: While it may be cheaper on a per GB basis to store data in COSMOS or Hadoop (big data) vs. SAN (small data), actual processing costs can be higher, since, typically, many more processing nodes are employed in a MapReduce operation compared to storage of the data files only. This is especially true for data-intensive operations, such as large SELECT DISTINCT operations. For situations where users repeatedly access the same data, it may be less expensive to run a big-data pipeline once and move it to a small-data system, with aggregation and storage on a SAN. However, this assumes you are able to control your ad-hoc big-data analysts and that they will comply with running such queries on SAN. In a traditional “keep it big” implementation, there is no way to prevent developers from running certain types of queries on the big-data system.
4. The Data Virtualization Solution: Unlocking Big Data for the Masses
What if we could create the illusion that all compatible data – all the data that logically comprises a subject area – is visible, present, and query-able from a single location? This is the goal of data virtualization. Virtualized data sets may include, for example, a number of Hadoop streams, various SQL tables, and several OLAP cubes into subject areas. A user of a virtual data set does not need to know the actual physical locations, or mixture of source types, of the data. He or she would only need to consider the logical subject areas and particular details of the data request. Server names, connection  strings, cube identifiers all become passé. If the user wants financial data on sprockets, including part numbers from a wholesaler from two years ago in a foreign subsidiary, she would go to a single subject area for “Sprocket Business.” If, instead, a user seeks information on cancellations of service plan subscriptions, including number of months of customer loyalty and manufacturing defect rates, he would go to the subject area for “Product Quality.” No longer would a user need to know to pull revenue data from Server XYZ and customers from Cube 123. The data virtualization service knows where to go to get the requested data while consistently maintaining the business logic.
With a service that abstracts the end user from the physical underlying data, a development team is able to focus on completing scenarios, supplying all the data that is available while controlling the cost and performance of the solution to most efficiently meet the needs of end users. Consider the example in section 3, where different analysts are running similar queries in COSMOS on a frequent basis. To answer these queries using the “leave it big” strategy, COSMOS must extract the same data and then aggregate it multiple times, potentially consuming vast resources with each repetitive occurrence. In a data-virtualized world, a developer for the virtual data set could 1) observe this usage pattern by analysts, since the same query is firing through a standardized, centralized service; 2) respond, by redesigning the query job. The developer for the virtual dataset could schedule the aggregations to occur automatically; then move the aggregations to whatever storage medium is necessary; and finally, direct all similar future queries to use the new data source. All of these efficiency improvements would happen without any action required the end users. The end users continue along their merry way, submitting the same queries in the same manner they are accustomed to.
Data Tiering. The optimization example above illustrates the concept of “data tiering”.
Data tiering, in conjunction with data virtualization, is what allows us to keep data big without sacrificing the ease-of-use and satisfying interactivity of small data. In reality, data tiering only provides the illusion of one big dataset while using some small data tactics to achieve this. With data tiering, a development team could choose to create as many, or as few, add-on small datasets as required to achieve the desired scenarios for performance, cost and data fidelity. To dive deeper into this topic, let’s examine the pros and cons of a few different approaches to data tiers.
Approach # 1: All Big. A team could certainly use data virtualization without data tiering. In other words, all data, in one very large data set, would physically be stored in Hadoop only. The advantage of this approach is that all data is available in one place. Also, with commodity hardware in a Hadoop cluster, there would be no pricey SAN costs. Also, this approach resolves the potential problem with data consistency between small data and big data systems. Unfortunately, there are also some big disadvantages to this extreme approach: First, the 80/20 rule: As a rule of thumb, we often find that about 80% of end users of data systems only access about 20% of the potential data. This means the most common queries would perform poorly compared to small-data systems, since the big-data systems will perform aggregations each and every time a query is executed. Alongside the poor performance, the aggregations would consume a large amount of resources and this would be the case over and over again in fulfilling the common scenarios.
Approach #2: Mirror the 80/20 Rule: As an alternative approach, a team could apply data virtualization alongside data tiering and utilize both one large Hadoop dataset and one SQL dataset. This scheme potentially supplies answers to 100% of the end user queries, but in this case, 80% of the queries – the most common queries – would be passed to the fast SQL database. Only 20% of the queries would be directed to the Hadoop big-data system. Since the Hadoop data is only used 20% of the time, it may be less expensive to store the data in Hadoop rather than having multiple marts on SAN.
Performance: With data tiers employed by the virtualization service for both Hadoop and SQL, queries can be tuned to be “fast enough.” Common, or mission-critical, scenarios can be pre-aggregated and/or placed on faster storage devices. By introducing additional data tiers, a development team could speed data delivery to provide the required output.
Discoverability: With both Approach # 1 and #2, data virtualization eliminates the pain of end users in having to seek out multiple locations for their data. It also avoids the need for users to learn and apply knowledge of multiple query languages such as SCOPE, HIVEQL, MDX, SQL, etc. Instead, end users need only learn the single language of the virtualization service. If the single language is a graphical query designer, usability is further improved.
5. Summary
The following comparison matrix summarizes the benefits of the current Small-Data and Big-Data approaches, contrasted with Data Virtualization with and without Data Tiering:
The current popular practice is to shrink big data into multiple small data sets. While this approach offers substantial usability benefits over big data, further improvements are possible with data virtualization. The greatest benefits are reserved for those that make multiple physical tiers of data available from a virtual data view.
With a virtualized dataset, a development team is able to focus on reducing and optimizing the physical datasets without the distraction of designing “friendly” physical structures and without worry of breaking the data experience of their data consumers. With a focus on backend efficiency, it’s conceivable that a previous physical model, e.g., supporting dozens and dozens of datasets, could be reduced to just two or three sets. From an operations standpoint, management of fewer physical datasets results in many benefits:
- Development Cost
- A Development team is able to answer more questions with fewer physical datasets. Fewer data sets translates to fewer people necessary to perform common tasks. For instance, if a team had dozens of data marts and needed to add the same dimension to all of them, it would take more time and/or resources than just doing so in two or three marts. In total, all things being equal over the course of a development cycle, a development team should be able to deliver more features. Alternatively, the team should be able to deliver the same amount of features but with fewer resources.
- Hardware Costs
- Having fewer datasets translates to less hardware and storage needs. With fewer data sets, development teams have more time per data mart to plan for the most appropriate hardware platform. The team is better able to match the best platform for each data tier based on cost and performance without being locked in to that platform long term: If, for example, a better platform becomes available, the team can switch without affecting their users, who are only consuming a virtual view of the data. Without constraints or dependencies on any particular platform, the overall data system is free to evolve and scale indefinitely.
- Single Source of the Truth
- With only one place for everyone to go for a given virtual subject area, business logic may be consolidated. End users are able to obtain more stable and expected results while making fewer mistakes. For example, with a single virtual subject area, a user would no longer need to attempt to transform similar data from two different sources. While differences and inconsistencies could certainly exist within a virtual subject area (e.g., a metric has a different rule in the USA compared to Canada), at a minimum the various rules may now be managed from a central location. End users have the means to clearly communicate gaps in expected results and the development team has a clear view to the application of the business rules. This improves the process of reconciliation and resolution of various data rules.
Beyond the operational benefits mentioned above, and perhaps most compelling, a team adopting a virtual data set is able to finally unlock its big data for the masses. Breaking down the physical barriers of big data systems, the end data users, from business analysts to execs to product planners, are able to interact with big data, using the same small-data tools, like Excel, they have always favored for discovering and communicating insights. No longer would a non-technical end user be required to submit special requests and wait for a team of developers to attempt to retrieve the data they desire. The self-service approach results in faster turnaround time and less guessing on the rules for how the data was obtained. Overall, the analysts are able to iterate faster, asking and answering more questions than ever before.
In conclusion, data virtualization, especially in conjunction with data tiering, may enable a development team to provide more complete data sets, with less resources, while exposing true big-data scenarios to the masses. This approach removes the barrier of physical data location which has always existed between the end users and the subject areas they know. Data virtualization also helps developers to focus on net new features: Rather than adding redundant columns to data marts and reports, which may or may not ever be used, developers are able to expose new data sources to customers. With data virtualization a wide variety of solutions are possible. Development teams are liberated to use whichever tools are most helpful in keeping data big while letting users work with the data in the manner and style that matters most to them.
